Calgary real estate investing: find, analyze and buy investment property
Browse investment properties for sale in Calgary, check the numbers on any of them, and buy with a REALTOR® who also manages rentals.
- REALTOR® at KO Realty
- Licensed property manager
- Speaks English, Bangla, Hindi and Urdu
Investment properties for sale in Calgary
Explore multi-family, fourplexes, duplexes, reported legal suites, inner-city condos up to $300,000 and land. Listings are discovery leads, not verified investment returns. Confirm suite status with the City and use the Deal Analyzer to examine your assumptions.
The 6 newest of 56 multi-family properties as at October 16, 2026.
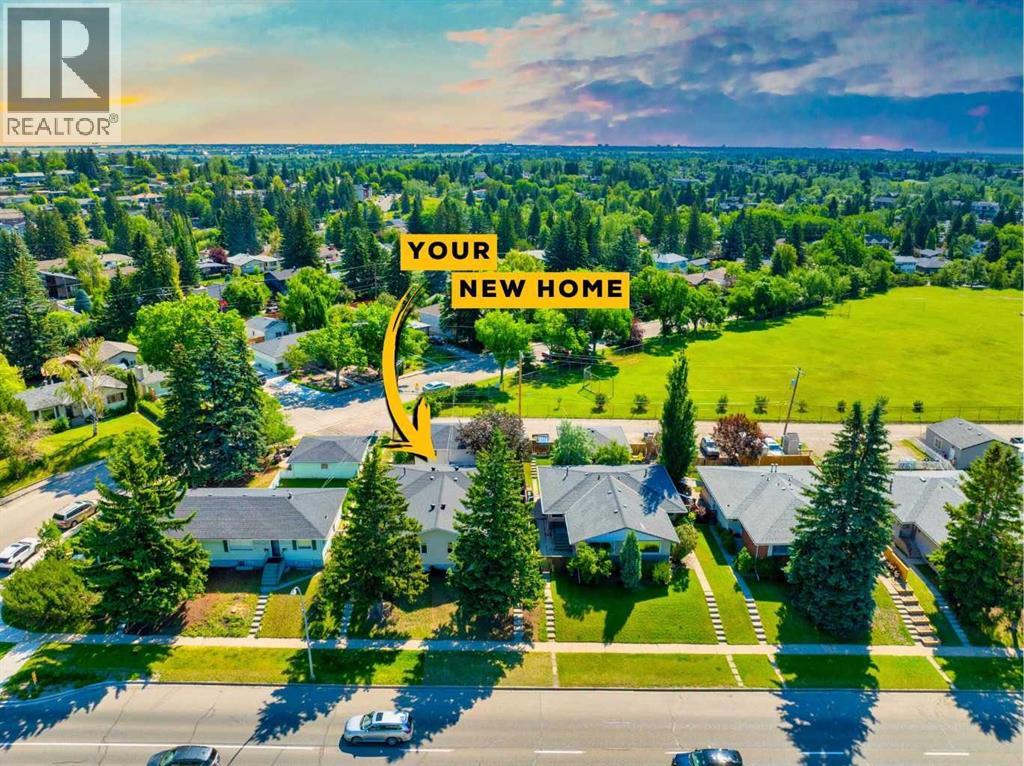
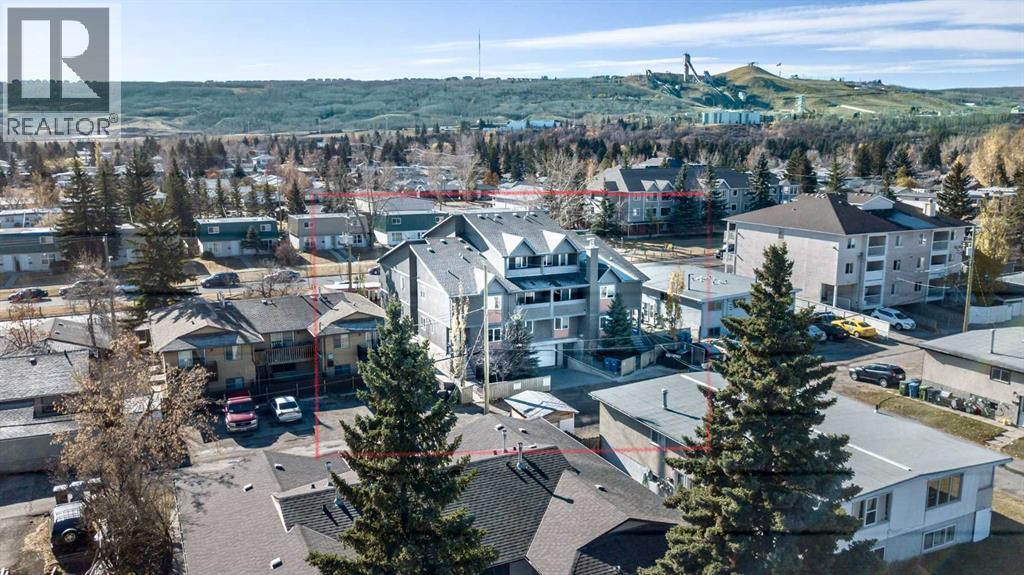
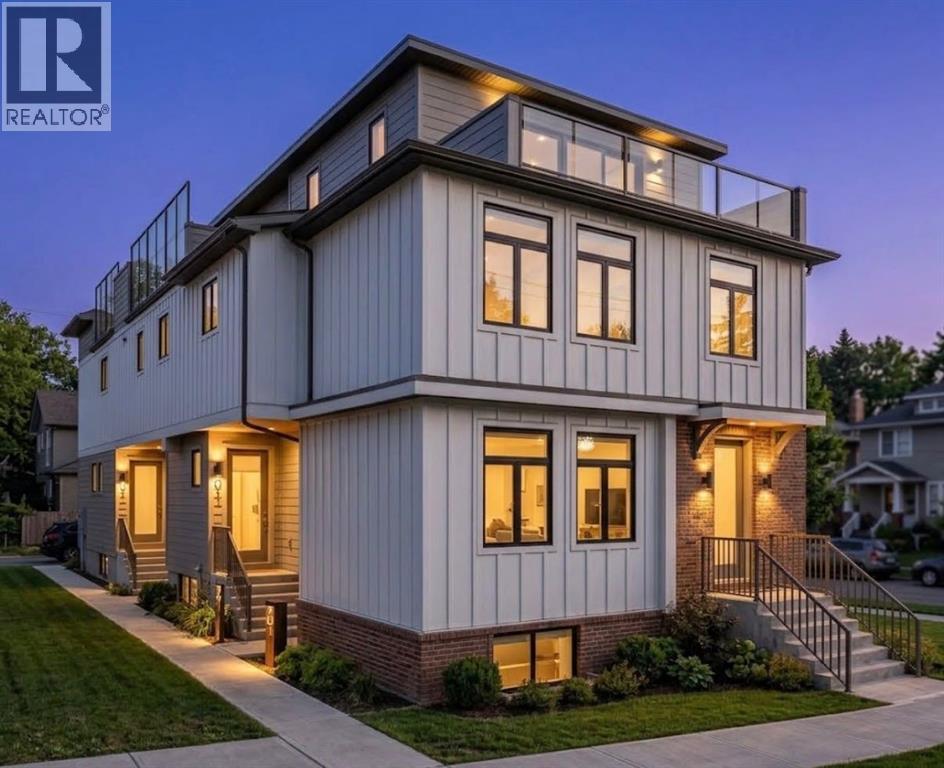
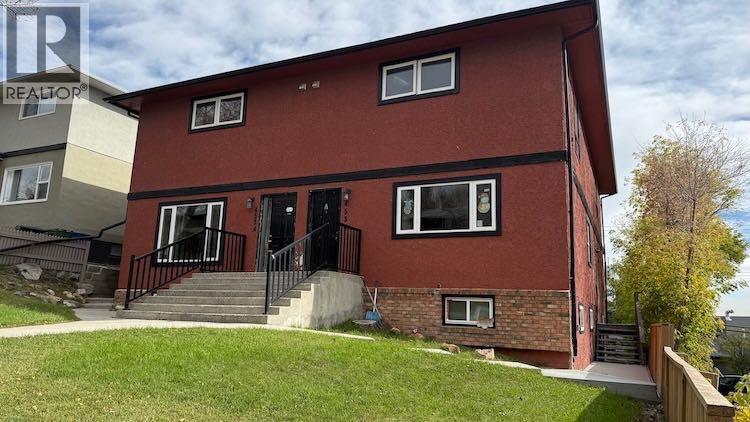
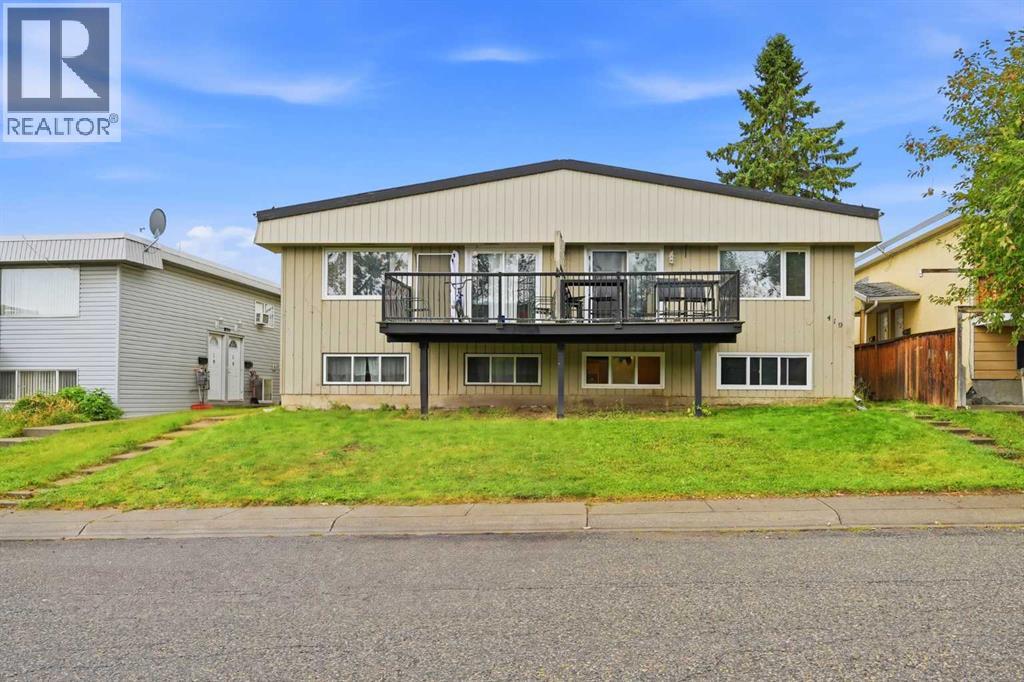
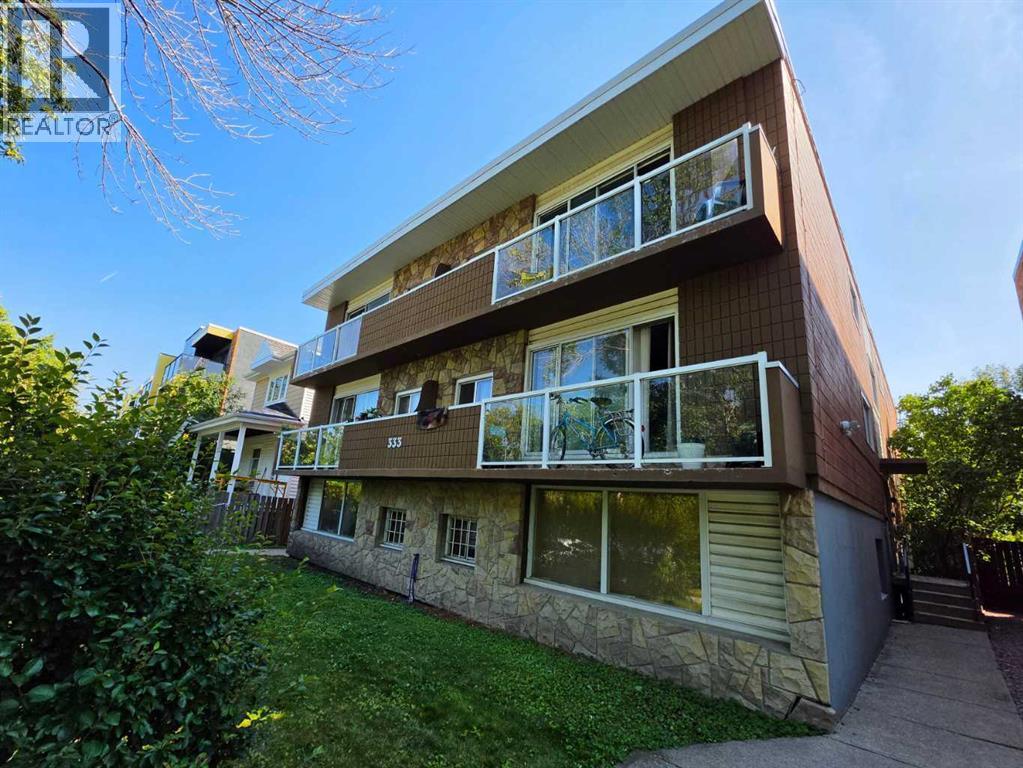
See all 56 multi-family properties with the map and filters →
Source: CREA Data Distribution Facility, active listings. The cards and counts load from the live feed when this page opens; the copy written into the page is the snapshot as at October 16, 2026, rebuilt daily. Each card names the brokerage that listed it, and properties shown are not necessarily listed by Ko Realty Ltd. Asking prices are what sellers are asking, not what homes sell for.
Tools to analyze a Calgary investment property
Deal Analyzer
Enter your rent, rate and costs. See cash flow, cap rate and DSCR for one property.
Listings to analyze
Calgary-area MLS® listings with price, taxes and fees as the listing brokerage reported them. No projected returns.
Investor workspace
Sign in with your email to keep your criteria, a watchlist and reports prepared for you.
Submit an opportunity
Owners and listing brokers: send a property or a business for review.
Types of investment property in Calgary
Duplexes for sale
Two homes on one title: side-by-side, up-down or semi-detached.
Fourplexes for sale
Four units in one building, as the listing itself describes it.
Multi-family for sale
Every small multi-unit building on the MLS® feed.
Homes with a legal suite
A house plus a rentable suite. Confirm the suite is legal with the City.
Inner-city condos under $300,000
A lower entry price. Condo fees and rental bylaws decide whether it works.
Commercial and business
What to check before you buy a commercial building or an operating business in Alberta.
New to investing? Read the Calgary real estate investment guide and how to compare Calgary neighbourhoods for a rental.
Calgary market numbers for investors
A benchmark price describes a typical home, not an average sale. More figures, by home type and area, on the Calgary market data page.
How I help you buy an investment property
Set your criteria
Budget, cash-flow goal, and how hands-on you want to be.
Shortlist
I send listings that fit and flag suite, zoning and condo-fee questions early.
Run the numbers
Rent, costs, financing and a rate stress test, with every assumption shown.
Offer and manage
I negotiate the purchase. After closing, KO Realty can manage the rental.
Halal or alternative financing? I work with buyers using halal home financing; see how halal home buying works in Calgary. I am a REALTOR®, not a lender.
How the numbers work: the formulas behind every investment analysis on this site.
Calgary real estate investing FAQ
Is Calgary real estate a good investment in 2026?
It depends on the property, not the city. In September 2026 the CREB® benchmark price was $566,700, down 0.82% year over year, with 3.93 months of supply. A rental works when its rent covers its costs at your price and rate. Check that in the Deal Analyzer before you decide. Alberta has no provincial sales tax, but rental income is still taxable.
How do I check the cap rate and cash flow on a Calgary rental?
Cap rate is net operating income divided by the price. Net operating income is rent minus vacancy, property tax, insurance, maintenance, management and any utilities you pay. Cash flow is what is left after the mortgage payment. The Deal Analyzer works out both for one property. I do not publish a citywide cap rate: sold prices in Alberta are licensed data, and one average cannot describe both a condo and a fourplex. The method is in how to work out a Calgary cap rate.
Does Alberta have rent control?
No. Alberta has no rent control: there is no limit on how much rent can go up. The limits are on how often and on notice. Rent can rise only once every 365 days, counted from the last increase or the start of the tenancy, whichever is later, and not at all during a fixed-term lease, where a new rent can only start in a new agreement after the term ends. On a periodic tenancy the notice is 3 full tenancy months for a monthly tenancy, 12 full tenancy weeks for a weekly one and 90 days for any other, in writing, stating the date it was given and the date the increase takes effect, and signed by the landlord or their agent. For an investor that cuts both ways: a below-market rent can be brought up to market, but only on the dates the Act allows, so if you are buying a tenanted property, check when the tenant last had an increase before you count on a higher rent. Find the earliest lawful date for a specific tenancy with the Alberta rent increase rules tool.
What makes a basement suite legal in Calgary?
A legal suite has the City of Calgary permits it needs, has passed inspection and is on the City's secondary suite registry. A listing that says "suite" may mean an unpermitted one, and the two are not the same purchase. Check the registry before you count the rent. More in what makes a Calgary suite legal.
Does the BRRRR method work in Canada?
BRRRR means buy, rehab, rent, refinance, repeat. It can work in Calgary, but the refinance decides it. Lenders typically refinance a rental at up to 80% of the new appraised value, so the appraisal, not your renovation budget, sets how much cash comes back out. The math is in BRRRR in Calgary.
Where can I find duplexes, fourplexes and multi-family properties for sale in Calgary?
On the live MLS® searches for each: duplexes and semi-detached homes, fourplexes, all multi-family and homes with a legal suite. They refresh from the CREA feed every 15 minutes, and you can save any search to get new matches by email.
Can you help if I invest from outside Alberta?
Yes. I work with investors buying from Ontario, BC and other provinces. Showings can be done by video, documents signed electronically, and the closing handled by an Alberta real estate lawyer. After closing, KO Realty can manage the rental. If you are not a Canadian citizen or permanent resident, check the federal ban on foreign buyers of residential property first. Start with buying in Alberta from Ontario.
Get help buying a Calgary investment property
Tell me your budget and goal. I will reply with listings and real numbers, not a sales pitch.
Sources: CREB® monthly housing statistics, September 2026, published 1 October 2026 (benchmark prices, months of supply, days on market). Listings: CREA DDF®, credited to each listing brokerage. Rent rules: Alberta's Residential Tenancies Act.
General information, not investment, tax, legal or lending advice. I am a REALTOR®, not a mortgage broker. Not intended to solicit anyone already under a written agreement with another brokerage.
Updated 8 October 2026 · By Mohammad Emon, REALTOR® (SRES®) and licensed property manager, KO Realty · RECA licence CON-00133897 · 403-888-4268